Comparison of Plot Coordinate Systems
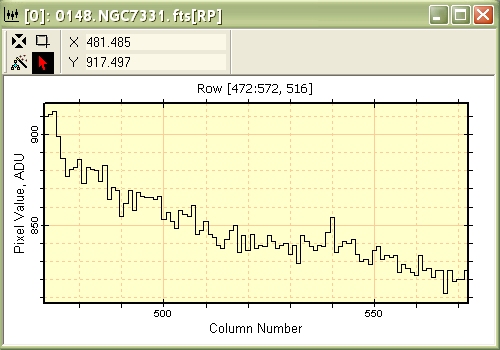
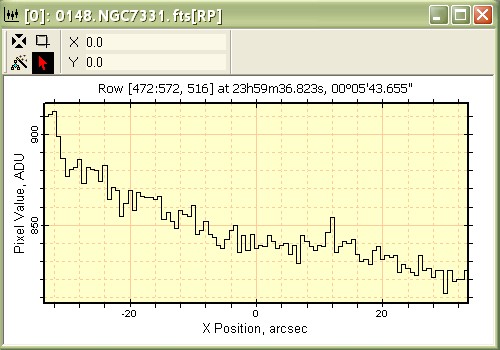
The figures below compare identical Row Profile plots using the systems of Pixel Coordinates and World Coordinates for the same image data.
|
Tip |
You can change the x and y axis labels, the caption, axis extent, and other properties afterwards using the Plot Properties dialog. |
The first figure below shows the Row Profile plot in the Pixel Coordinate System. The x axis measures position as a column number on the image. The plot caption "Row [472:572, 516]" indicates that the plot data are from columns 472 through 572 (101 total columns) in row 516.

This figure below shows the same image data plotted in the World Coordinate System. The plot caption lists the column,row span like above but also lists the world coordinates (right ascension, declination) at the middle of the data. This is X Position = 0 on the horizontal axis. The row data are plotted relative to this point in units of arcseconds.

Mira Pro x64 User's Guide, Copyright Ⓒ 2023 Mirametrics, Inc. All
Rights Reserved.