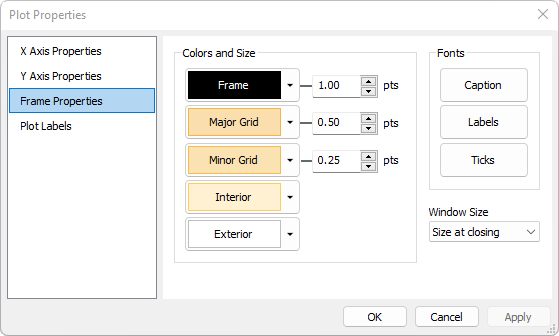
Plot Frame Properties
The Frame Properties page allows you to configure the frame of the plot, including the fonts, color, and grids.
To open the Frame Properties page, open the Plot Properties dialog and select the Frame Properties tab.

|
Frame Properties |
|
|
Colors and Size |
These buttons control the colors used to draw the plot box (not the plot data). |
|
Frame |
Click this button to open a Color Selector for choosing the color used for drawing the plot box. |
|
Major Grid |
Click this button to open a Color Selector for choosing the color used for drawing the major grid line. |
|
Minor Grid |
Click this button to open a Color Selector for choosing the color used for drawing the minor grid line. |
|
Interior |
Click this button to open a Color Selector for choosing the color used for drawing the interior of the plot box. |
|
Exterior |
Click this button to open a Color Selector for choosing the color used for drawing the exterior of the plot box. |
|
Size |
These fields control the width of the lines drawn for the specific Plot Properties—ticks, major grid, and minor grid. |
|
Fonts |
These buttons control the fonts used to draw plots |
|
Caption |
Click this button to open a Font Selector for setting fonts used to draw the plot box caption. |
|
Labels |
Click this button to open a Font Selector for setting fonts used to draw the plot axis labels. |
|
Ticks |
Click this button to open a Font Selector for setting fonts used to draw the plot tick labels. |
|
Window Size |
Select the default size for new plot windows. |
|
Tip |
The Window Size property is used to establish a default size when new Plot Windows are opened. You can use this for example, to clone the current Plot Window size for future windows. There is also an Open as Bottom Most option in the Plot Properties dialog which prevents new plots from opening on top of the Image Window from which it was created. |
Mira Pro x64 User's Guide, Copyright Ⓒ 2023 Mirametrics, Inc. All
Rights Reserved.