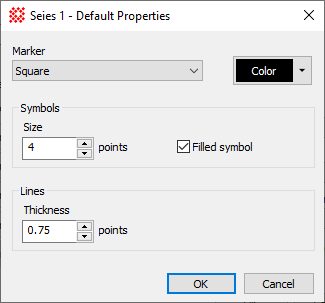
Plot Default Marker Properties
To change the default marker style, size, color, and other properties for a plot series before a plot is created from an image, use the Plot Default Marker Properties dialog. You also can change the marker properties after the plot is created by using the Plot Series Properties dialog.
The Plot Default Marker Properties dialog opens from the Image Plot Properties dialog.

|
Marker |
Select the marker style from the choices in the list. |
|
|
Click this button to set the color of the marker symbol and connecting line. |
|
Symbol Size |
This field sets the marker width in terms of the standard unit of text points, with 1 point being 1/72 inch. |
|
|
Check this box to cause markers to be filled with a solid color. Otherwise, markers are drawn with an outline. |
|
Line Thickness |
This field sets the width of lines in terms of the standard unit of text points, with 1 point being 1/72 inch. This affects error bars and connecting lines. |
Plot Series Default Properties
Mira Pro x64 User's Guide, Copyright Ⓒ 2023 Mirametrics, Inc. All
Rights Reserved.