Calculate Airmass
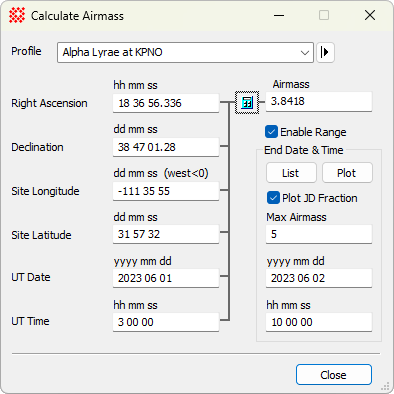
The Calculate Airmass command opens a worksheet dialog where you can calculate an airmass value or a range of values. The calculation of a single airmass value requires the 6 quantities shown in the left left hand column of the window below. To calculate a range of airmass and list or plot the result, enter values into the right hand column and select the appropriate options. For a description of input formats, see the section Data Formats, below.
The Calculate Airmass command opens from the Utilitiesmenu and the [P] button on the main toolbar.
|
Properties for Airmass Calculation |
|
|
Right Ascension |
The right ascension coordinate in units of "hh mm ss" for hours, minutes, and seconds of time. The seconds value may include decimal digits. |
|
Declination |
The declination coordinate in units of "dd mm ss" for degrees, minutes, and seconds of angle. The degrees value may be negative and the seconds value may include decimal digits. |
|
Site Longitude |
The longitude of the observing site in units of "dd mm ss" for degrees, minutes, and seconds of angle. The degrees value may be negative and the seconds value may include decimal digits. NOTE: The longitude is negative west of the Prime Meridian at Greenwich, England (e.g., the Americas), as per the World Geodetic System specification WGS84. |
|
Site Latitude |
The latitude of the observing site in units of "dd mm ss" for degrees, minutes, and seconds of angle. The degrees value may be negative and the seconds value may include decimal digits. |
|
UT Date |
The UT date of observation in units of "yyyy mm
dd" for year, month, and day. The year requires 4 digits but the
month and day may each use 1 or 2 digits. When the |
|
UT Time |
The UT time of observation in units of "hh mm ss"
for hours, minutes and seconds. Each value may use 1 or 2 digits.
When the |
|
|
Click this button to calculate a single value of
airmass using values in the left hand column. Values in the right
hand column under |
|
Airmass |
The airmass based on all entries in the left hand column of text fields. |
|
|
Options in the right hand column are used to list or plot a range of airmass. |
|
|
Check this box to activate the right hand column of text fields for computing a table or graph of airmass over a range of time. |
|
End Data & Time |
This group controls the calculation of a range of airmass between the UT date and time in the right and left columns. |
|
[List] |
Click this button to list the airmass at 10 minute intervals in the range of UT Date and UT Time. |
|
[Plot] |
Click this button to plot the airmass in the range of UT Date and UT Time. |
|
|
Check this box to subtract the integral part of the JD value at the UT Date and UT Time at the beginning of the range. |
|
Max Airmass |
Enter the maximum value of airmass to be listed and plotted. Usually a value of 3 to 5 is practical. |
|
UT Date (right column) |
The Ending UT date of observation in units of "yyyy mm dd" for year, month, and day. The year requires 4 digits but the month and day may each use 1 or 2 digits. |
|
UT Time (right column) |
The ending UT time of observation in units of "hh mm ss" for hours, minutes and seconds. Each value may use 1 or 2 digits. |
The date, time, latitude, and longitude fields accept multiple values in the form of (Year, Month, Day), (Hours, Minutes, Seconds), and (Degrees, Minutes, Seconds), abbreviated as yyyy mm dd, hh mm ss, and dd mm ss, respectively. Mira tolerates a variety of delimiters between the numbers in each field. All the accepted delimiters are listed in the table below. The window shown above uses spaces between the numbers, which is listed as (space) in the table below. You can also use several symbols such as / and the letters h, m, d, etc. to separate values in the field. Choose a delimiter that works for you because it is easy to type or makes the entry easy to understand.
|
Field delimiters |
|
|
hh mm ss |
(space) / : – , " ' H h M m S s |
|
dd mm ss |
(space) / : – , " ' D d M m S s |
|
yyyy mm dd |
(space) / : – , " ' Y y M m D d (degree sign) |
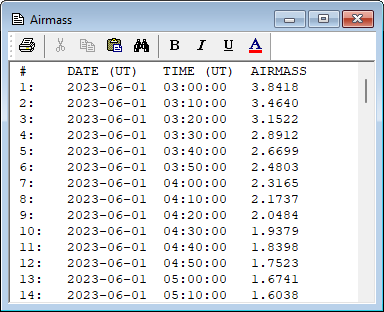
The [List] and [Plot] buttons use ending values of date and
time in the right hand column to list and plot the range of airmass
over time. Using the settings shown in the window above, the
airmass was tabulated (listed) and plotted over the period 03h UT
on June 1 through 10h UT on June 2 (a range of 1 day 7 hours). The
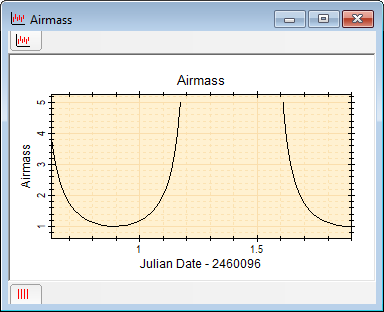
following pictures show the results in a Text Window and Plot Window. Note that the Plot Window
shows the result of using the ![]() Plot JD
Fraction option which subtracts the integral part of
the starting JD Value from the data and lists it in the X-Axis
Label.
Plot JD
Fraction option which subtracts the integral part of
the starting JD Value from the data and lists it in the X-Axis
Label.
Mira Pro x64 User's Guide, Copyright Ⓒ 2023 Mirametrics, Inc. All
Rights Reserved.