
  |
CHistogram:Calc
The Calc method computes the histogram of a data array.
Table = CHistogram:Calc( Data )
This function returns an array containing the histogram frequencies for the Data array. The histogram is dependent on the binning parameters that control the size of each bin and how many bins are used over what range of values. Several class methods are provided for setting the binning strategy. If you do not configure the binning strategy, then the histogram is computed using the full range of sample data values and a bin count that is the lesser of the square root of the number of sample points and 100.
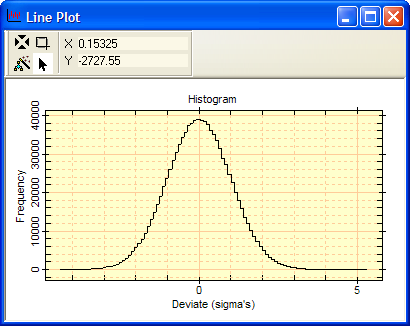
The following script computes and plots a histogram of 1 million Gaussian random numbers. The 4th line creates a nice x-axis that makes the distribution symmetrical about 0 and places the center of each bin at the x-coordinate of the bin. Since there are 1,000,000 values in the data sample and the histogram uses auto binning, the number of elements in the histogram array y will be 100 (see above).
|
|
-- create a CHistogram object |
|
|
-- create 1,000,000 values |
|
|
-- compute the histogram |
|
|
|
|
|
-- plot the histogram |
|
|
|
This script created the plot shown below.
