1-D Data Visualization
Full Article
 This
Brief describes the various plot types that can be created by Mira for
visualizing 1-D data. Mira's plotting architecture was designed to efficiently and effectively work with
data sets consisting of many points, many images, and many series. Mira can
create representations like step-line plots and x/y error bars. The Mira
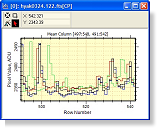
Plot Window was designed for interactively displaying and measuring 1-D data
in real time. A non real-time "Chart" package for creating
presentation-quality plots is also included.
This
Brief describes the various plot types that can be created by Mira for
visualizing 1-D data. Mira's plotting architecture was designed to efficiently and effectively work with
data sets consisting of many points, many images, and many series. Mira can
create representations like step-line plots and x/y error bars. The Mira
Plot Window was designed for interactively displaying and measuring 1-D data
in real time. A non real-time "Chart" package for creating
presentation-quality plots is also included.
Although most plots are made from data in an Image
window, plots can also be generated from tabular measurements and by using the extensive and versatile collection of plotting functions in the
Mira Pro Script module.
Not discussed here are topics like scripted plots, working with plot data,
plot commands, toolbars,
plot attributes, etc.