This Brief shows some 3-D capabilities of Mira Pro x64. This document is provided for informational purposes only, as both platforms were discontinued several years ago.
3D Plot Window
The diagram below describes components of the 3D Plot window in Mira Pro x64. When a single image is plotted, as opposed to a multi-image set, the Animation Control Toolbar is not visible.

At left, the toolbar shows 7 tics, indicating that 7
stacked images are rendered in 3-D. They can be animated or blinked,
manually or up to many frames per second, while rotating or changing the
palette or other attributes.
Below, the 2-D image
window uses a rectangle to mark the region. The
3-D rendering is to its right.
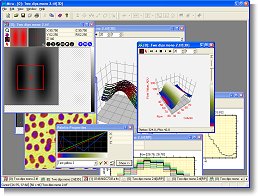
Example
The example below shows a Region of Interest of a 2-D image of a late-wood cell in both 2-D and 3-D. To get the plot you don't need to prepare the image in any special way — just outline the region of interest on your image and click the button. You can tilt, rotate and zoom in/out on the 3D plot in real time. And if your images form a time sequence showing some changing feature, simply display them in the window as usual, mark the region and click the button as described, and you get a stack of 3D renderings which you can animate and rotate, or change the palette and other attributes in real-time. And it works for images having bit depths ranging from 8 bits per pixel through 64 bit per pixel floating point.

TIFF format Image
This 2-D image of wood cells is displayed in a Mira Image Window and zoomed 4x. A single button click produced the 3-D view at right using the data inside the image cursor (red).

Intensity Surface Plot
This Intensity Surface uses a palette to map the image intensity to grayscale or color. This technique is often called a "4-D Plot". The plot attributes may be changed after rendering.
Changing the Plot Attributes
The examples below show variations made by changing the plot attributes in the 3D Drawing Attributes dialog.

Intensity Surface Stepped Ribbon Mode
The Overlay Grid is enabled. A pseudo-color palette is used to separate Z values. A ribbon plot makes the plot transparent in the column direction so that data in all rows can be seen from any direction.

Intensity Surface plot in Stepped Ribbon Mode
The Overlay Grid is disabled. As for intensity surface plot, the apparent separation of data Z value can be adjusted by changing or manipulating the palette.

Illuminated Surface Plot in Ribbon Mode
The Overlay Grid is enabled. This mode connects pixels with a sloped facet, while the Stepped Ribbon uses a horizontal cap to show the 2D pixel value and vertical facets between pixels.

Intensity Surface Plot with Quad Pixels
Continuous surfaces are often best displayed using a quad or triangle mode and no overlay grid.

Intensity Surface Plot in Pedestal mode
The Overlay Grid is enabled. This representation shows each pixel as standing columns of data in the Z direction.

Intensity Surface Plot in Pixel mode
The Overlay Grid is enabled. This shows only the pixel top to reduce clutter and it allows the plot to be transparent from all directions.