Example of Changing Plot Series Properties
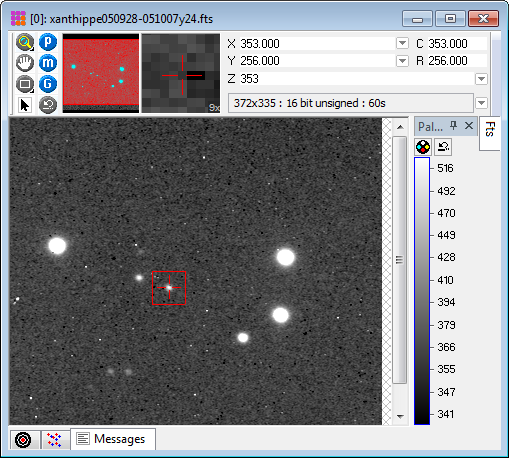
The pictures below show the effect of changing the properties of an existing plot using the Plot Series Properties tool. To begin, an image was opened andthe Image Cursor was moved onto the center of a star in preparation for making a cross sectional plot through the star. In this example we will plot a series of rows and then observed where a particular row appears in comparison to the slices through the other rows.
After centering the cursor on the star, a plot was created using the Range of Rows command in the drop-menu for the Row Profile Plot toolbar button:
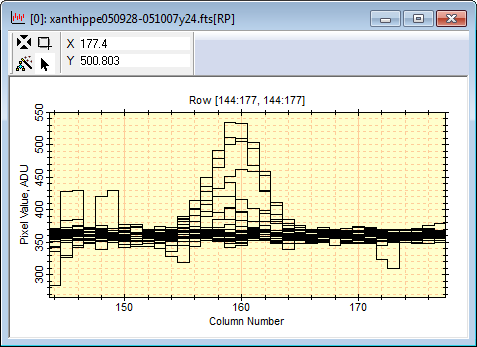
Now suppose you wanted to see where the slice in row 168. Right click on the plot to open thePlot Context Menu and select Series Properties... command. This opens the Plot Series Properties dialog as shown below.
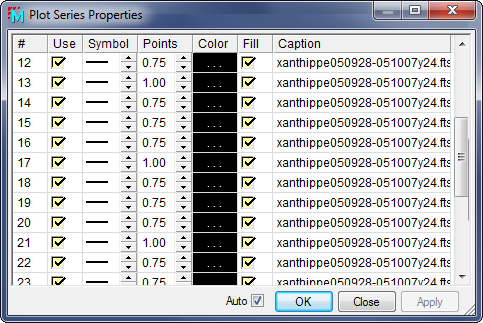
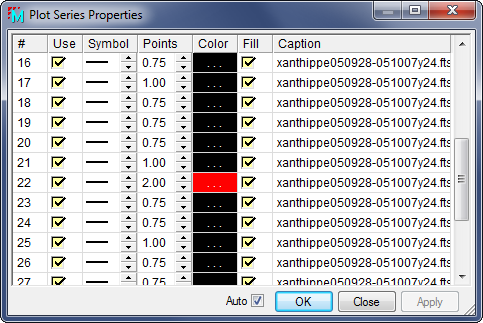
The Plot Series Properties dialog lists the marker properties for each series as a grid in the Plot Window. Enlarge the dialog and scroll to find row 170 from the entry in theCaption column of the grid. This occurs in row 22. Working with row 22, couble-click the[...] cell in the Color column and select the red color. Then use the up arrow in the Symbol column to increase the drawing thickness to 2.00 points. We will not modify the Symbol orFill properties because these apply to symbol plots rather than line plots. After making these changes the dialog appears as follows:
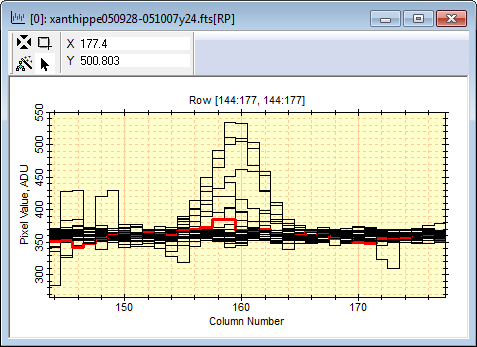
Click [OK] on the dialog to close it and the Plot Window look will appear as follows: